Seasonally Dry: Low Water Levels in Anoka County 

As of August 4, 2026, the U.S. Drought Monitor classified all of Anoka County as being in moderate drought. However, the causes and effects of low water levels are often complex. Water levels reflect the combined effects of precipitation, snowmelt, temperature, groundwater conditions, and water use—and different water bodies can respond at different rates.

Where Did the Water Go?

During dry periods, less rain and snowmelt are available to replenish lakes, streams, wetlands, and groundwater. Heat waves (like we have experienced this summer) can intensify these conditions by increasing evaporation from open water and moisture loss from plants and soil. Hot weather also increases demand for lawn irrigation, placing additional pressure on groundwater supplies. When extreme heat, limited rainfall, and increased water use occur together, water levels can decline more quickly.

Groundwater is especially important in Anoka County, as ~94% of residents receive their drinking water from groundwater. Many local lakes and wetlands are closely connected to the water table, while groundwater also helps maintain streamflow between rain events. When groundwater declines, nearby surface waters may remain low even after rainfall. A single storm can temporarily improve conditions, but sustained precipitation is often needed for recovery. 
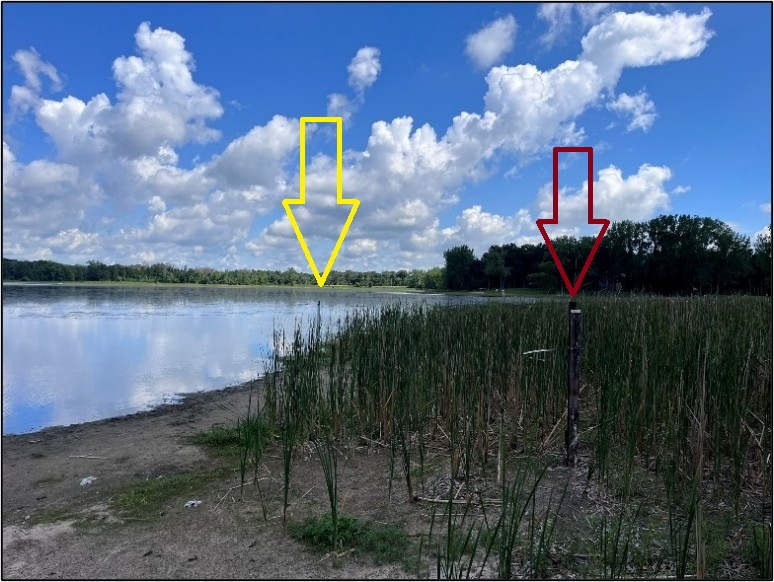
Photo: Coopers Lake in northern Anoka County. The red arrow marks the 2025 monitoring location, which was completely dry by summer 2026. The yellow arrow marks the relocated 2026 monitoring location.

Why Low Water Levels Matter

Shallow water warms more quickly, which can stress out fish and other aquatic life. Reduced streamflow may limit habitat and decrease the amount of cool, oxygen-rich water available to aquatic organisms. Pollutants and nutrients can also become more concentrated when less water is available to dilute them. Shorelines, rocks, stumps, and other hazards may become exposed, affecting boating and water access.

Wetlands naturally expand and contract, and some periodically dry out. These dry phases can benefit certain plants and wildlife. Long-lasting drought, however, can reduce habitat and lower shallow groundwater levels across the surrounding landscape. 
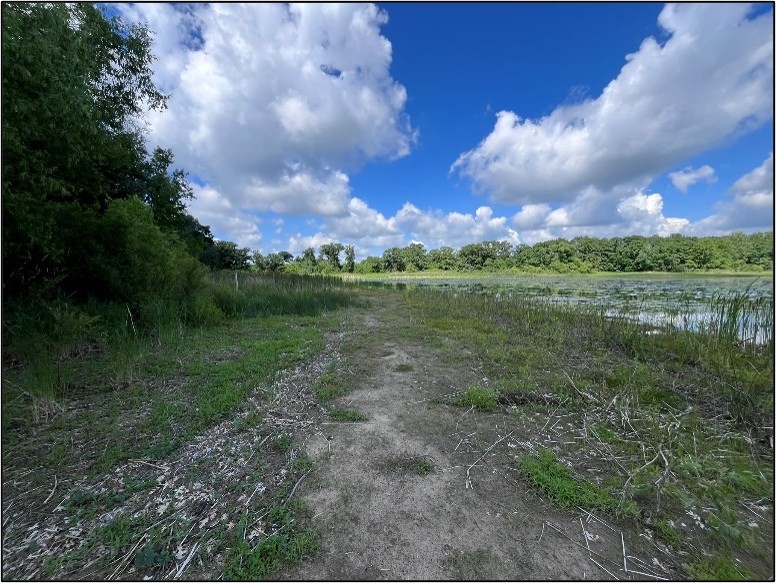
Photo: Exposed lakebed on Coopers Lake. Although prolonged drought creates serious concerns, occasional low-water periods can benefit shallow-lake ecosystems by exposing dormant seeds, encouraging native wetland vegetation, consolidating sediment, and creating valuable wildlife habitat.

 What Residents Can Do

Everyone can help reduce pressure on local water resources during these dry/hot conditions:

• Follow watering restrictions or schedules established by your city.
• Water lawns and gardens during the early morning, when less water is lost to evaporation.
• Water deeply but less frequently and allow established lawns to go dormant when practical.
• Repair leaking faucets, toilets, hoses, and irrigation systems.
• Use native plants adapted to Minnesota's climate that generally need less water once established.
• Maintain natural vegetation along shorelines to protect soil, provide habitat, and reduce polluted runoff.
• Avoid fertilizing immediately before rain and keep yard debris and other waste out of streets and water bodies.
• Do not dredge, fill, remove aquatic plants, or reshape shoreline or lakebed without first checking permit requirements.

Water Levels Can Recover—but It Takes Time
Water resources do not always respond immediately when rain returns. Soil moisture may need to recover before water can infiltrate deeply enough to recharge groundwater. Lakes, wetlands, and streams that depend on groundwater may therefore recover more slowly than rainfall totals alone suggest.

ACD and its partners track precipitation, lake and stream conditions, wetland hydrology, and groundwater levels throughout the county. Residents can find statewide drought updates through the MN DNR or contact Kris Larson, Water Resource Specialist, at This email address is being protected from spambots. You need JavaScript enabled to view it..
  137 Hits

HydroClim Minnesota

"HydroClim Minnesota" is a new electronic newsletter put out monthly by MNDNR Climatologist Pete Boulay. ACD has partnered with Pete for years to manage a network of precipitation volunteers throughout Anoka County.

"HydroClim Minnesota" summarizes weather conditions and other weather events occurring throughout the state and the resulting impact on water resources. By subscribing to the newsletter you can learn exciting facts such as, a storm event occurring on December 15, 2021 was not only the warmest day ever recorded in the month of December but it also involved Minnesota's first documented tornado for the month of December!

To learn more fun facts about weather in your state visit https://mndnr.gov/hydroclim. 

  3248 Hits

2019 Precipitation in Minnesota

2019 was another banner year for precipitation in Minnesota, with over 20 individual annual precipitation records set, and the state turning in its wettest year on record.

Precipitation totals for the year exceeded 30 inches over all but about 5-10% of the state, mainly in far northern Minnesota, with totals exceeding 50 inches in parts of southern and southeastern Minnesota. Well over half of the state was 12-20 inches (or 50-70%) wetter than normal. Annual surpluses of that magnitude over such a large area contributed to 2019 being Minnesota's wettest year on record, on a statewide-average basis, with an average of 35.51 inches. This eclipsed the old record of 33.93 inches, set in 1977.

Although no climate observing station was able to break the statewide individual annual precipitation record of 60.21 inches set by Harmony in 2018, many stations with over 50 years of observations did break their own annual precipitation records. Rochester International Airport led the pack with 55.16 inches, breaking its old record by more than 11 inches.

The Twin Cities International airport, part of the longest station history in the state, had just broken its record in 2016, but broke it again in 2019, with 44.17 inches. Other records fell throughout the state. The majority of these stations broke records that had been set this decade.

Even closer to home, the ACD has utilized the precipitation data collected by our volunteer observers to assist with putting our monitoring well data in context. We have observed sustained wetland hydrology because of the abundance of precipitation. How this will affect how wetlands are managed in the present and future will need to be addressed by the current wetland regulatory rules and by utilizing the data we collect when reviewing wetland delineations.

This information is provided at the DNR Climate website:https://www.dnr.state.mn.us/climate/journal/top-weather-and-climate-stories-2010s.html

Here is a partial list of the records set this year.


Station

2019 Precip records (in.)

Previous record(yr.)

Rochester

55.16

43.94 (1990)

Owatonna

53.50

48.40 (2016)

Zumbrota

48.60

45.52 (2010)

Lake City

43.85

43.59 (2002)

Minneapolis - St. Paul

43.17

40.32 (2016)

Mora

43.08

41.63 (2010)

U of M St. Paul

42.95

41.67 (2016)

St. Cloud

41.92

41.01 (1897)

Itasca U of M

37.59

35.64 (1985)


  4175 Hits