ACD Projects Dashboards: Tracking and Visualizing Conservation Benefits
When projects are installed, ACD staff calculate and document the benefits produced by them. Measurable benefits for water resource improvement projects include metrics such as nutrient and sediment reductions to local waterbodies. For ecological projects, the total area restored or enhanced is quantified. Until recently, these numbers lived in project-specific documentation, but they can now be viewed altogether in ACD's new interactive projects dashboards.
With dashboards, you can explore the cumulative benefits produced through projects such as habitat restorations, streambank stabilizations, pollinator plantings, and stormwater best management practices. Many projects have multiple benefits; for example, rain gardens trap and filter polluted stormwater while also providing habitat for pollinators. Altogether, these tools provide a user-friendly way to track achievements within and across years.
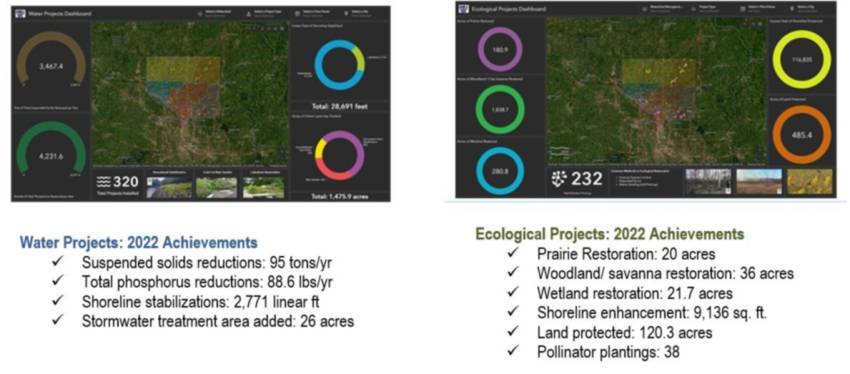
You can apply filters based on location, date range, and project type. For example, selecting the "Last Year" option in the date range dropdown will give you a summary of all conservation benefits achieved in 2022. Pan throughout the map and click on the points to learn more about individual projects. The gauges will adjust to summarize the benefits produced by the projects you're viewing.
ACD Contact: Breanna Keith,