Check Out Ice Duration Trends Throughout Minnesota
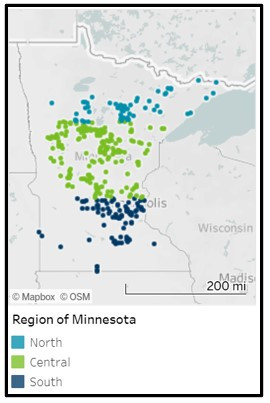
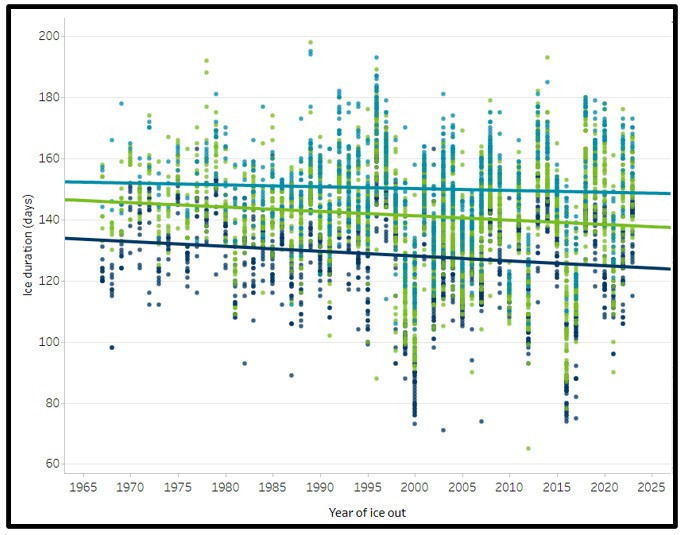
With the warmer winter so far in 2023/2024, this is a good time to revisit Minnesota data on historical duration of ice cover. MPCA has interactive graphs showing lake ice durations over many years on their Climate Change and Minnesota's Surface Waters page. Choose the "Lake ice durations" tab at the top. The graph below shows the overall trend of lake ice duration (in days) from 1967 to 2023, with the colors representing Minnesota lakes in the north, central and south portions of the state.
You can choose to evaluate trends in the each of the three regions of the state, or for many individual lakes, over a period of record of your choice. See more details on the following tabs of Minnesota Pollution Control Agency's Climate Change and Minnesota's Surface Waters page: Lake ice durations, Lake temperature, River flows & floods, Biological communities and FAQ.